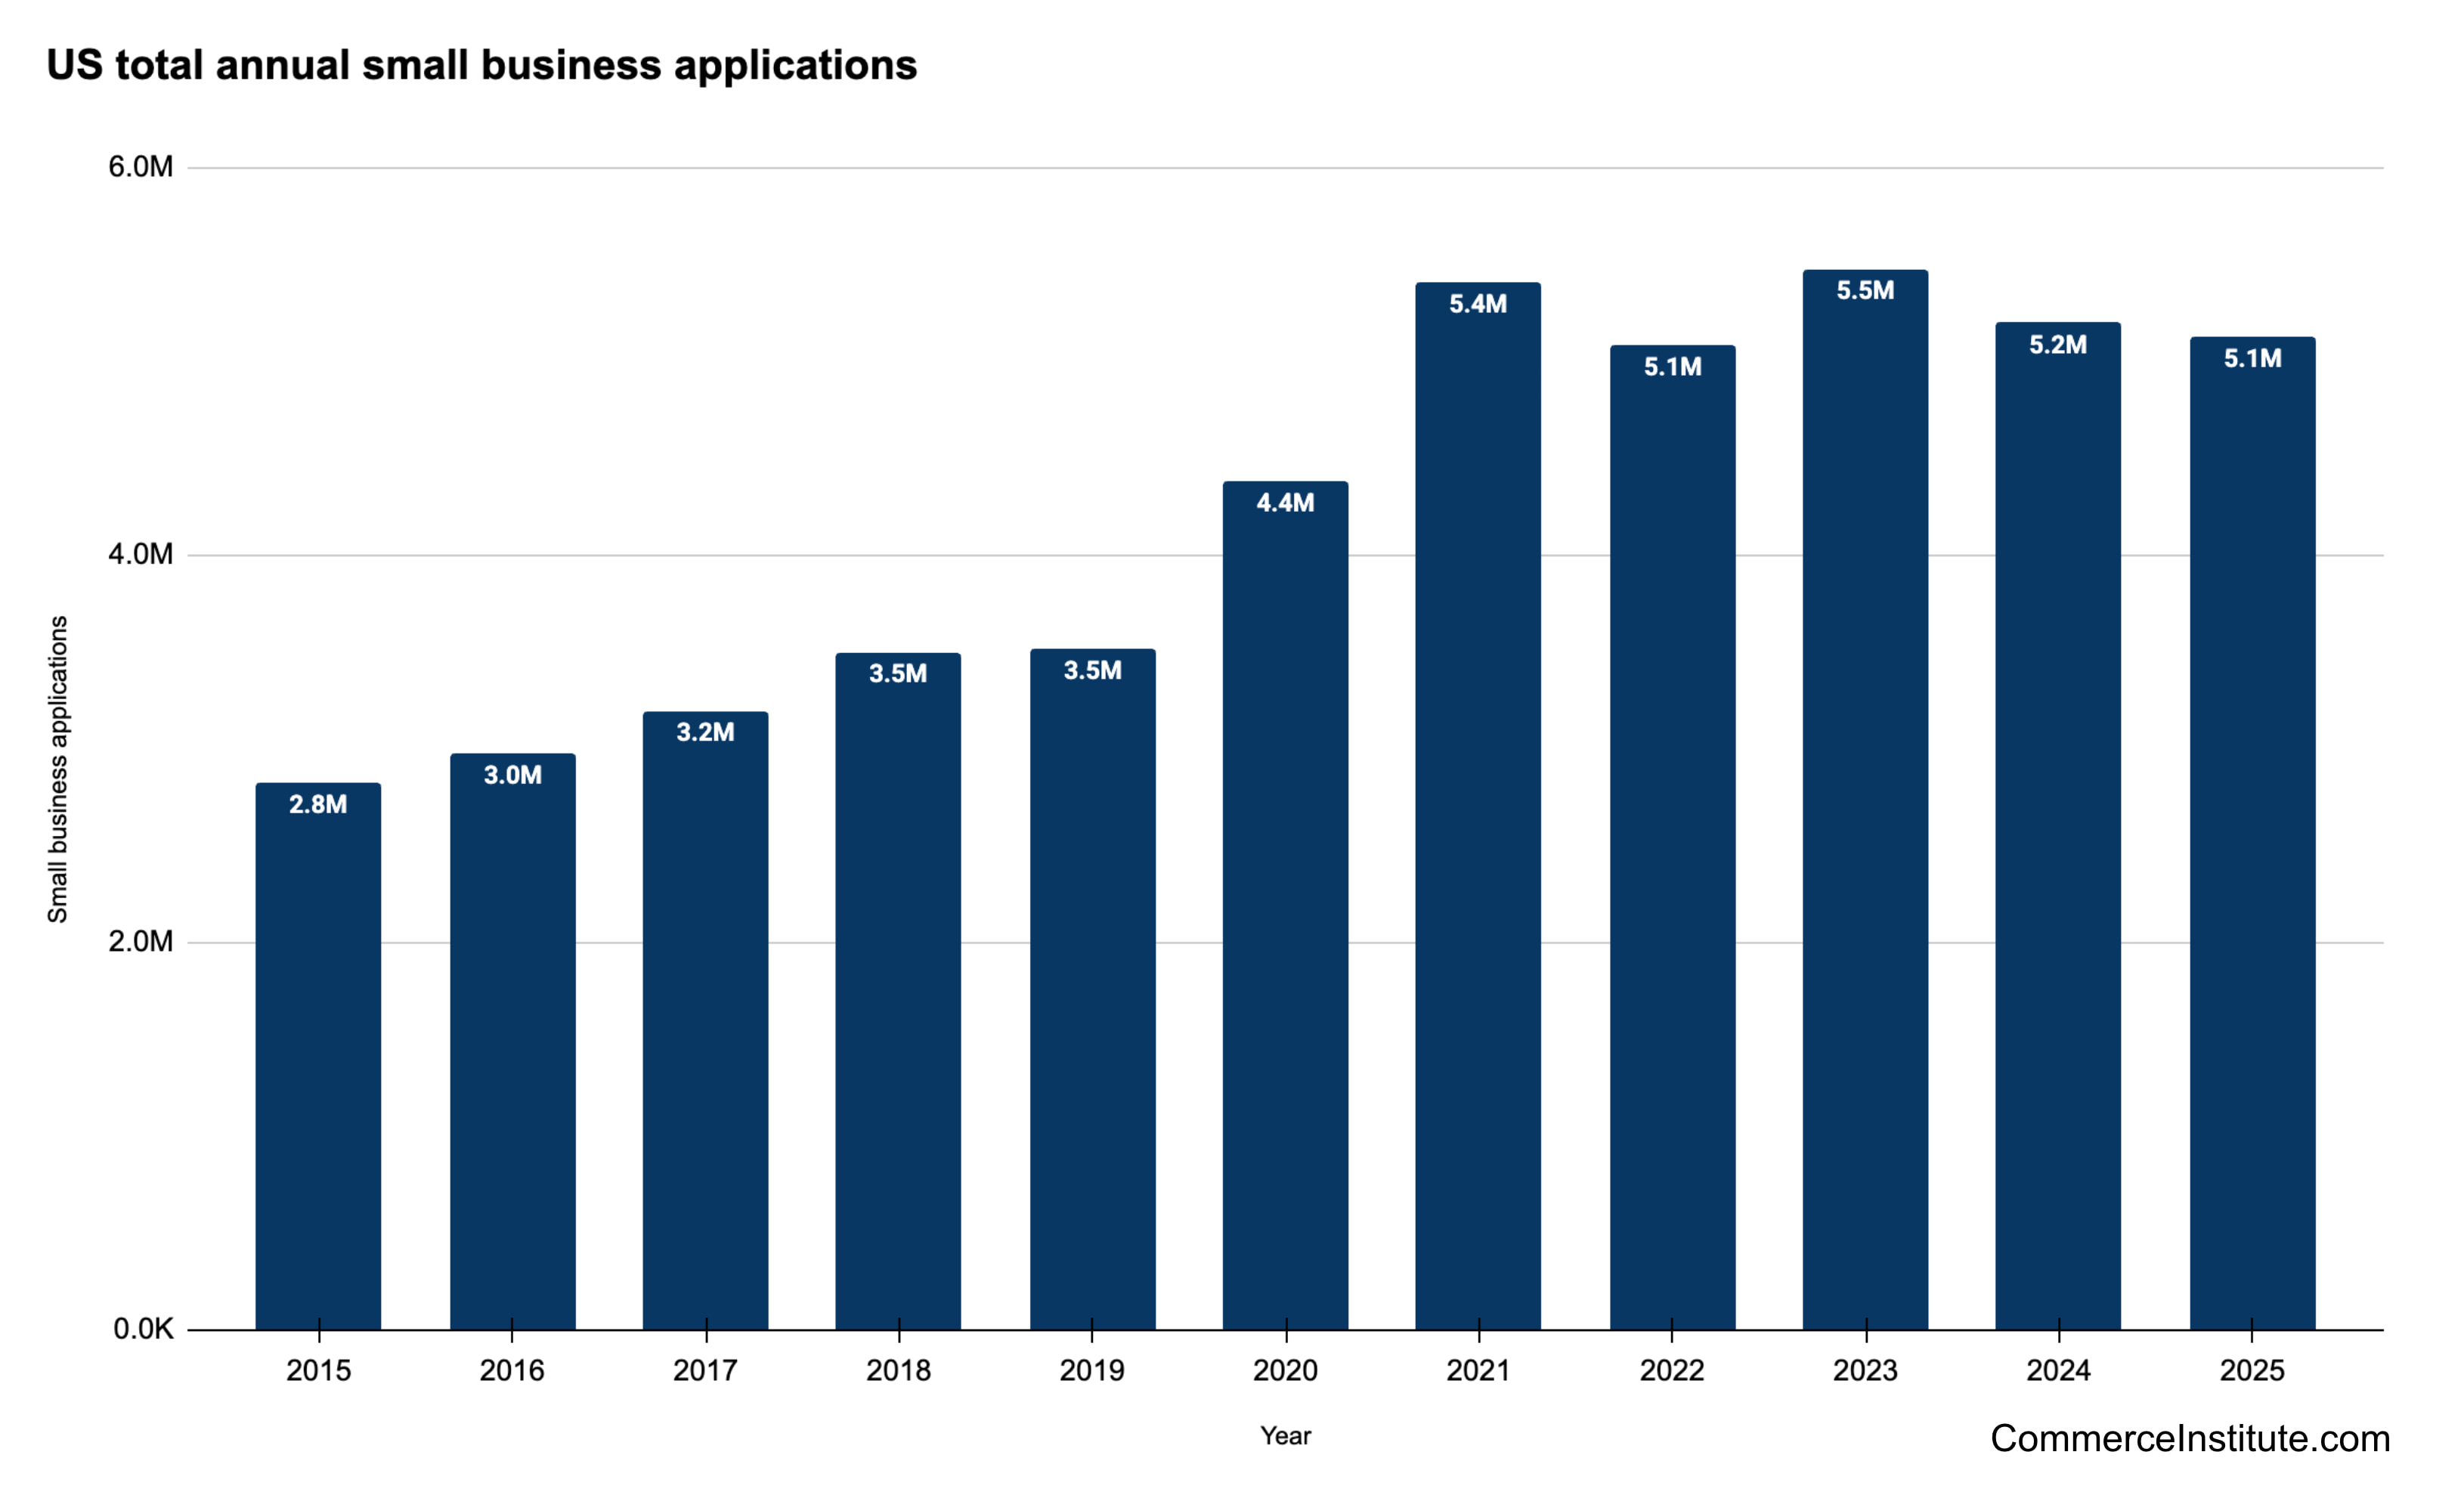
Data from the US Census Bureau shows 5,125,775 new businesses were started from January through November 2025 (so far; December 2025’s data releases in a few weeks). The onset of the pandemic in 2020 has driven a surge in new business creation, so business formation has stayed elevated compared to pre-pandemic years.
On average, there are 5.1 million businesses started every year. That average is from the past five years of business formation data in the United States. According to data from the US Census Bureau, the 5,479,144 businesses started in 2023 is the highest year on record, beating out the previous record of 5,409,643 new businesses started in 2021.
The total number of businesses started in 2024 also represents a 47.8% increase from the number of new businesses in 2019.
How many businesses are created each year?
| Year | Number of New Business Applications | % Change vs. the Prior Year |
|---|---|---|
| 2025 (Jan–Nov) | 5.1 million | (Incomplete) |
| 2024 | 5.2 million | -5.1% |
| 2023 | 5.5 million | +7.8% |
| 2022 | 5.1 million | -6.0% |
| 2021 | 5.4 million | +23.5% |
| 2020 | 4.4 million | +24.5% |
| 2019 | 3.5 million | +0.5% |
| 2018 | 3.5 million | +9.5% |
| 2017 | 3.2 million | +7.4% |
| 2016 | 3.0 million | +5.4% |
| 2015 | 2.8 million | — |
Of course, not all of these newly formed businesses will stick around—many won’t even last past their first year. In fact, research from the US Small Business Administration shows that the average failure rate for new businesses is the following:
- 70% of new businesses survive beyond two years
- 50% of new businesses survive beyond five years
- 30% of new businesses survive beyond ten years
- 25% of new businesses survive beyond fifteen years
So as we can see, the number of new business applications and the number of new businesses that survive more than a few years are quite different. However, the actual survival rate of new businesses is much better than the commonly-cited myth that 50% of businesses fail in the first year.
New businesses started during the pandemic
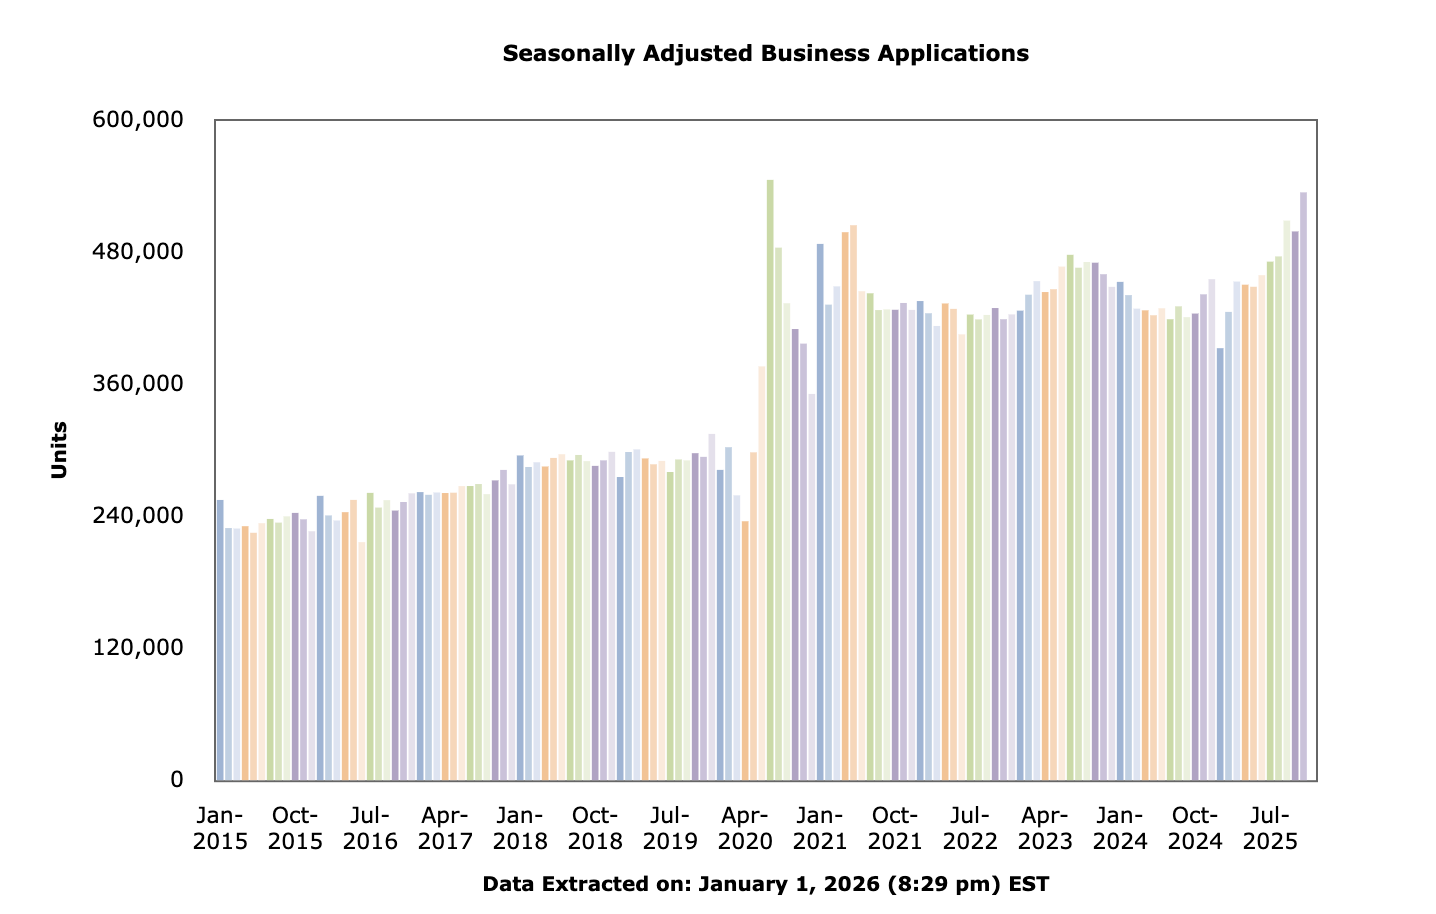
The increase in small business applications has continued into 2024 after the surge brought about by the pandemic: 5,199,984 businesses were started in 2024. Although the pace of new business creation has slowed slightly, the rate of new businesses being created is still far higher in 2024 than it was prior to the pandemic.
During Q1 2024, from January to March, there were 1,324,280 new business applications in the US. That’s a 56.8% increase in new business formations compared to Q1 2020 and a 51.2% compared to Q1 2019.
And although the data might initially seem to show that new formations are holding steady—the number of new business applications in Q1 2024 is 0.1% higher than in Q1 2023—when we look at Q4, it’s a different story. There were 4.2% fewer new businesses started in Q4 2024 than in Q4 2023, which implies that new business formation slowed toward the end of 2024. The entrepreneurial awakening, it seems, is not over yet. This data can be pulled here.
📚 Learn more: How Many Small Businesses Are There in the US?
Number of new businesses created every quarter
| Year | Q1 New Business Formations | Q2 New Business Formations | Q3 New Business Formations | Q4 New Business Formations |
|---|---|---|---|---|
| 2024 | 1,324,280 | 1,280,396 | 1,272,311 | 1,322,997 |
| 2023 | 1,323,531 | 1,358,675 | 1,416,346 | 1,380,592 |
| 2022 | 1,274,574 | 1,268,726 | 1,266,712 | 1,273,295 |
| 2021 | 1,370,475 | 1,448,955 | 1,299,614 | 1,290,599 |
| 2020 | 844,813 | 910,758 | 1,465,274 | 1,159,598 |
| 2019 | 875,787 | 871,004 | 863,557 | 907,144 |
| 2018 | 870,040 | 875,547 | 877,543 | 876,092 |
| 2017 | 783,877 | 790,759 | 797,675 | 824,623 |
| 2016 | 736,213 | 715,760 | 764,538 | 759,760 |
| 2015 | 713,636 | 690,340 | 712,412 | 707,337 |
Why have so many new businesses been created in the past two years? The prevailing theory after the numbers started to rise was that there was a backlog of business applications held up by the pandemic.
That was slightly true, but the number of backlogged cases was small and not the main driver of the increase. An analysis published by The Economist argued that the pandemic provided both the motive to start (with millions of people losing their jobs) and the means to start (via stimulus checks and high unemployment insurance) that drove this entrepreneurial awakening.
The 2024 numbers show that the increase in new business formations was not a temporary trend, but we’ll need more time to determine what the new baseline is this year and beyond.
The second chart was created by the US Census Bureau and can be found here.