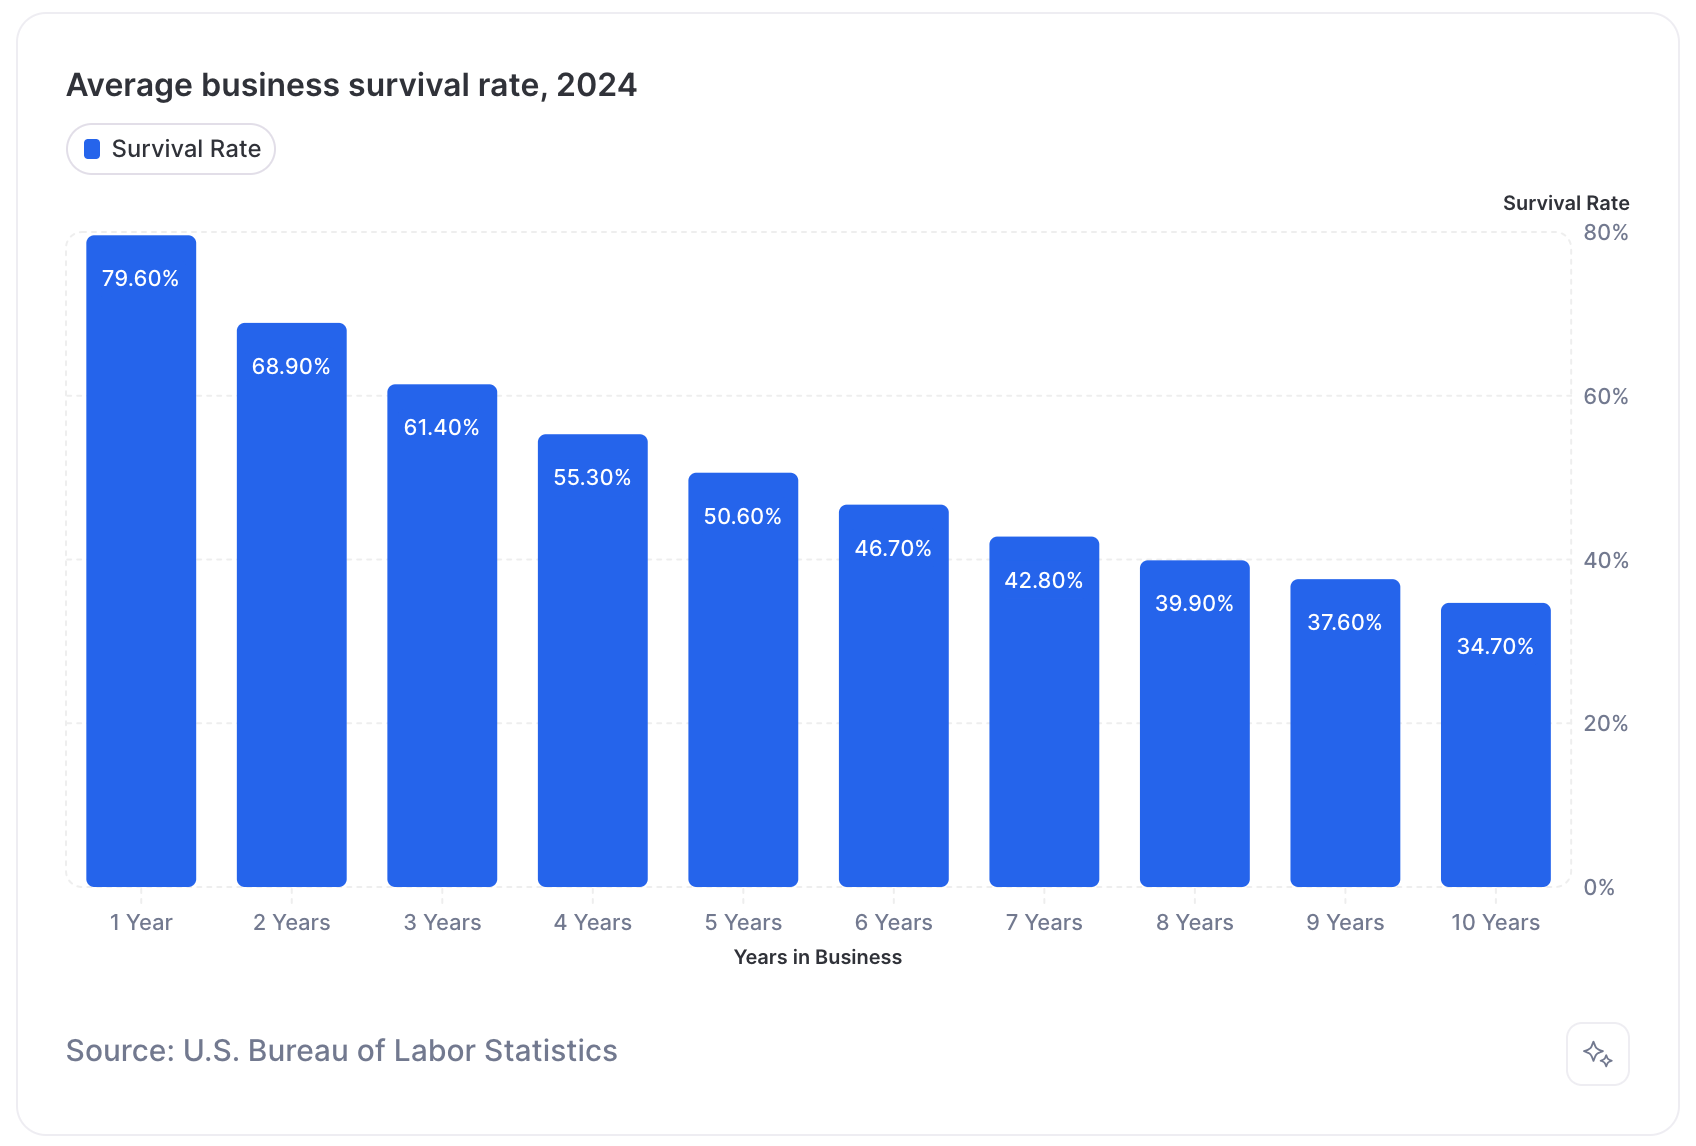
According to 2024 data from the U.S. Bureau of Labor Statistics, 20.4% of businesses fail in their first year after opening, 49.4% fail in their first 5 years, and 65.3% fail in their first 10 years.
That’s a much better survival rate than the frequently cited myth that half of businesses fail in their first year. They don’t. However, the average survival rate of a business does greatly depend its industry.
Small business failure rate by industry
New data from the shows the first year survival rate of businesses ranges from 74.9% to 87.5%, depending on the industry.
By the 10th year, this gap widens further. The 10-year average survival rate of a business ranges from 24.5% all the way up to 50.5% depending on the segment or industry.
| Industry | 1-Year Survival Rate | 5-Year Survival Rate | 10-Year Survival Rate |
|---|---|---|---|
| All businesses (Total private sector) | 79.60% | 50.60% | 34.70% |
| Agriculture, forestry, fishing, and hunting | 87.50% | 66.20% | 50.50% |
| Utilities | 80.70% | 56.60% | 45.70% |
| Manufacturing | 82.60% | 57.70% | 43.60% |
| Real estate and rental and leasing | 83.90% | 58.70% | 42.20% |
| Retail trade | 84.20% | 58.30% | 41.70% |
| Construction | 76.00% | 53.90% | 40.10% |
| Other services (except public administration) | 82.50% | 56.90% | 39.60% |
| Educational services | 81.80% | 56.00% | 38.90% |
| Accommodation and food services | 82.50% | 55.30% | 38.20% |
| Finance and insurance | 80.90% | 53.20% | 37.50% |
| Health care and social assistance | 82.70% | 55.10% | 35.70% |
| Arts, entertainment, and recreation | 80.60% | 52.90% | 35.40% |
| Administrative and waste services | 76.90% | 48.90% | 34.20% |
| Transportation and warehousing | 79.40% | 50.10% | 34.00% |
| Management of companies and enterprises | 81.40% | 50.30% | 33.00% |
| Professional, scientific, and technical services | 77.00% | 46.30% | 30.90% |
| Wholesale trade | 78.20% | 46.50% | 30.10% |
| Information | 74.90% | 44.30% | 29.10% |
| Mining, quarrying, and oil and gas extraction | 79.40% | 40.20% | 24.50% |
What business type is least likely to fail?
Businesses in the “Agriculture, forestry, fishing, and hunting” segment perform best. They have only a 12.5% failure rate in their first year, a 33.8% failure rate by their fifth year, and a 49.5% failure rate by their tenth year.
How many businesses fail in the first year?
About 20.4% of businesses fail in the first year. Besides agriculture, businesses in the “Retail trade” segment perform best with only a 15.8% failure rate in their first year.
How many businesses fail in the first 5 years?
About 49.4% of businesses fail by their fifth year. Besides agriculture, businesses in the “Real estate” segment perform best with only a 41.3% failure rate by their fifth year.
How many businesses fail in the first 10 years?
About 65.3% of businesses fail by their tenth year. Besides agriculture, businesses in the “Utilities” segment perform best with only a 54.3% failure rate by their tenth year.
Which businesses are most likely to fail?
Small businesses in the “Information” sector are the most likely to fail in their first year. The second-most likely business to fail in the first year are “Construction” businesses.
After the fifth year, businesses in the “Mining, quarrying, and oil and gas extraction” are the most likely to fail on average.
| Industry | 1-Year vs. Average | 5-Year Survival Rate | 10-Year Survival Rate |
|---|---|---|---|
| Agriculture, forestry, fishing, and hunting | 7.90% | 15.60% | 15.80% |
| Utilities | 1.10% | 6% | 11% |
| Manufacturing | 3% | 7.10% | 8.90% |
| Real estate and rental and leasing | 4.30% | 8.10% | 7.50% |
| Retail trade | 4.60% | 7.70% | 7% |
| Construction | -3.60% | 3.30% | 5.40% |
| Other services (except public administration) | 2.90% | 6.30% | 4.90% |
| Educational services | 2.20% | 5.40% | 4.20% |
| Accommodation and food services | 2.90% | 4.70% | 3.50% |
| Finance and insurance | 1.30% | 2.60% | 2.80% |
| Health care and social assistance | 3.10% | 4.50% | 1% |
| Arts, entertainment, and recreation | 1% | 2.30% | 0.70% |
| Administrative and waste services | -2.70% | -1.70% | -0.50% |
| Transportation and warehousing | -0.20% | -0.50% | -0.70% |
| Management of companies and enterprises | 1.80% | -0.30% | -1.70% |
| Professional, scientific, and technical services | -2.60% | -4.30% | -3.80% |
| Wholesale trade | -1.40% | -4.10% | -4.60% |
| Information | -4.70% | -6.30% | -5.60% |
| Mining, quarrying, and oil and gas extraction | -0.20% | -10.40% | -10.20% |
Are restaurants most likely to fail?
There’s a popular statistic that claims 90% of restaurants fail in their first year and are the businesses with the worst survival rate. This is false and was popularized by a 2000s TV advertisement.
The Bureau of Labor Statistics co-produced a report with UC called Restaurant Mortality in the Western US which reveals the real restaurant failure rate. You can read the paper here.
Here’s a quote from the paper:
In stark contrast to the commonly cited statistic that 90 percent of restaurants fail in their first year, only about 17 percent of restaurants failed in the first year—lower than the average first-year failure rate of 19 percent for all other service-providing businesses.
It turns out, restaurant’s show better survival rates than many service-based businesses. And generally have comparable or even better survival rates than the average business.
Failure rate of popular business types
How many retail businesses fail?
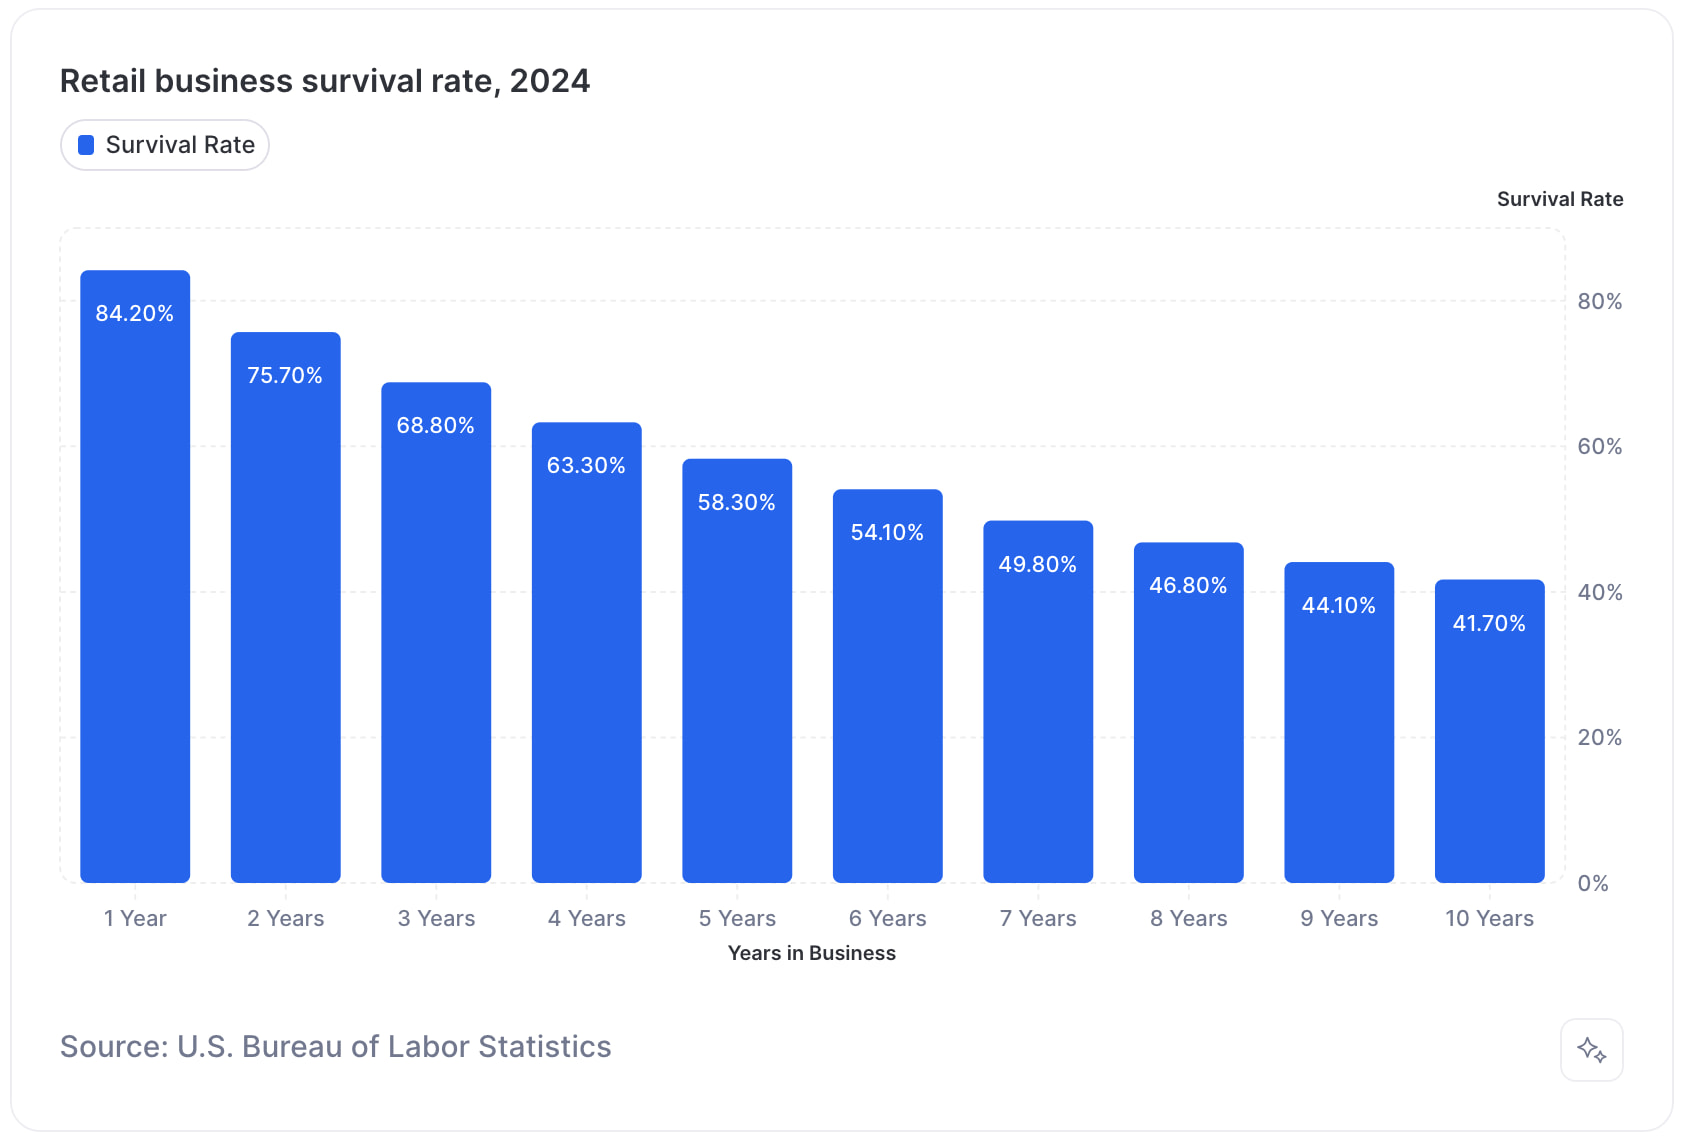
- 1st Year: Around 15.8% of retail businesses fail in their 1st year of business. That means the 1-year survival rate for retail businesses is roughly 84.2%.
- 5th Year: Around 41.7% of retail businesses fail in their 5th year of business. That means the 5-year survival rate for retail businesses is roughly 58.3%.
- 10th Year: Around 58.3% of retail businesses fail in their 10th year of business. That means the 10-year survival rate for retail businesses is roughly 41.7%.
Note: It’s indeed just a coincidence that the failure and survival rates seem to swap between the 5th and 10th year of business.
How many real estate businesses fail?
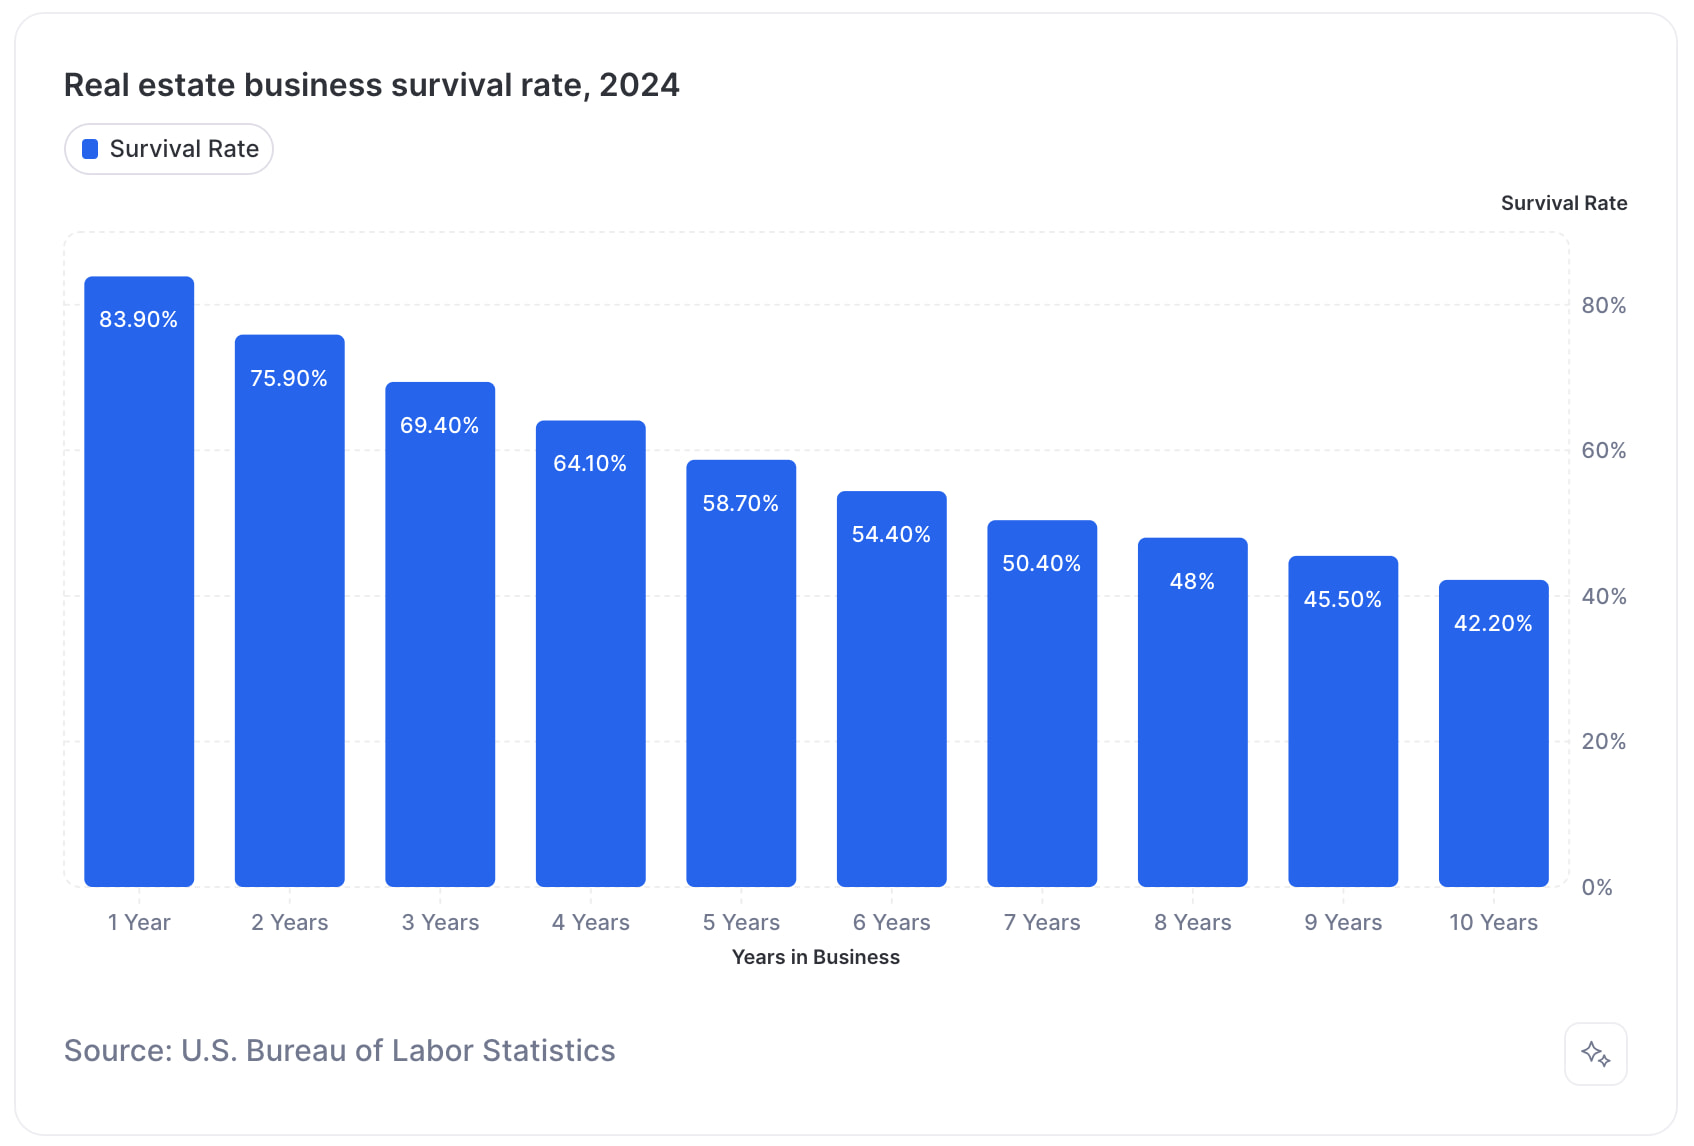
- 1st Year: Around 16.1% of real estate businesses fail in their 1st year of business. That means the 1-year survival rate for real estate businesses is roughly 83.9%.
- 5th Year: Around 41.3% of real estate businesses fail in their 5th year of business. That means the 5-year survival rate for real estate businesses is roughly 58.7%.
- 10th Year: Around 57.8% of real estate businesses fail in their 10th year of business. That means the 10-year survival rate for real estate businesses is roughly 42.2%.
How many restaurants fail?
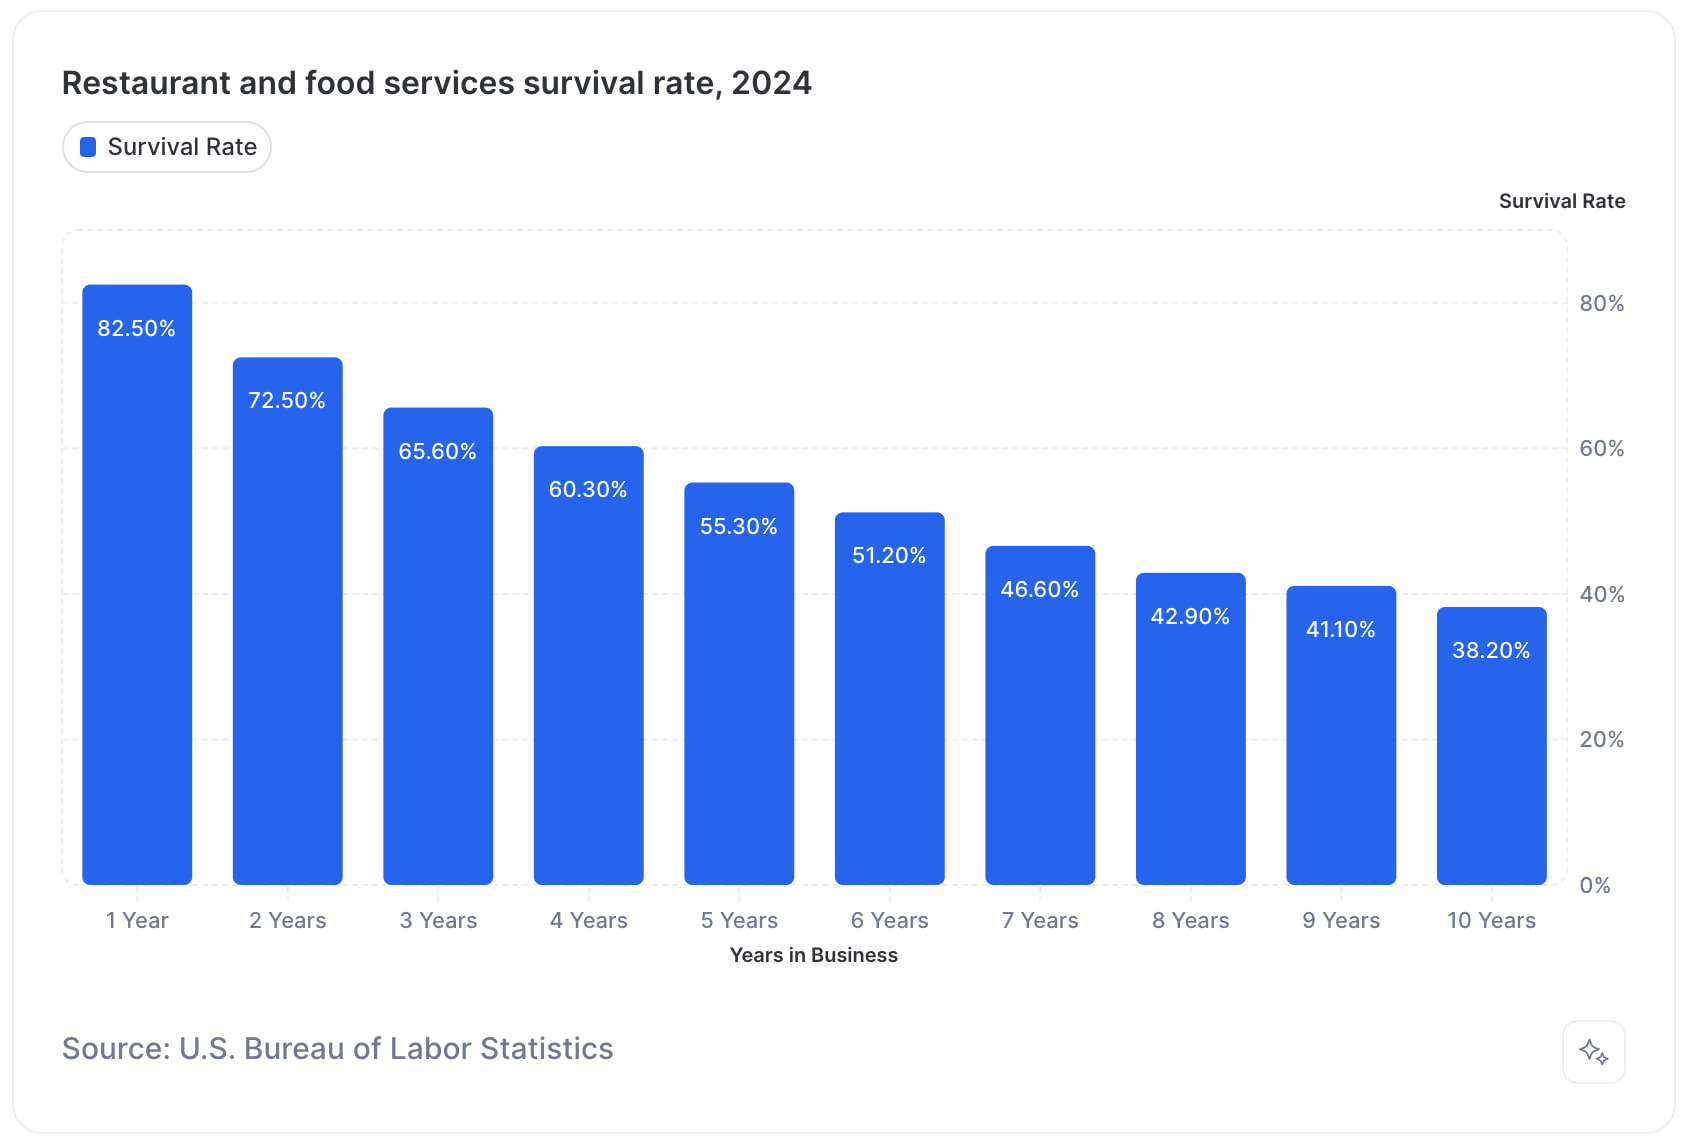
- 1st Year: Around 20.1% of restaurants fail in their 1st year of business. That means the 1-year survival rate for restaurants is roughly 80.9%.
- 5th Year: Around 48.6% of restaurants fail in their 5th year of business. The means the 5-year survival rate for restaurants is roughly 51.4%
- 10th Year: Around 65.4% of restaurants fail in their 10th year of business. That means the 10-year survival rate for restaurants is roughly 34.6%.
How many service-based businesses fail?

- 1st Year: Around 17.5% of service-based businesses fail in their 1st year of business. That means the 1-year survival rate for service-based businesses is roughly 82.5%.
- 5th Year: Around 43.1% of service-based businesses fail in their 1st year of business. That means the 1-year survival rate for service-based businesses is roughly 56.9%.
- 10th Year: Around 60.4% of service-based businesses fail in their 1st year of business. That means the 1-year survival rate for service-based businesses is roughly 39.6%.
Reasons why businesses fail
Figuring out why small businesses fail is a bit trickier because “failure” as defined by these statistics is simply the business no longer existing—anything else will have to be self-reported by the founder, and that isn’t always reliable. CB Insights research based on over 100 startup post-mortems found these reasons listed most often for why the founder thought the business failed:
- 42% – no market need for their services or products
- 29% – ran out of cash
- 23% – didn’t have the right team running the business.
- 19% – bested by a competitor
- 18% – pricing and cost issues
- 17% – failed because of a poor product offering
- 17% – failed because they lacked a business model
- 14% – failed because of poor marketing
- 14% – failed because they ignored their customers
📚 Read this next: How Many Businesses Are Started Every Year?
1. No market need
Product/market fit is the number one killer of new businesses. Reaching product/market fit typically means creating a product that is faster, cheaper, or easier to use than competing products or creating a product that serves a poorly-served segment of customers.
For example, Partake Foods was founded by a mother who wanted to find snacks for her daughter, who is allergic to gluten. Partake now provides gluten-free, vegan, and non-GMO cookies—a differentiating factor that helped them stand out in the crowded snacks vertical.
The other market factor to consider is whether a product category is growing or slowly declining. Generally speaking, there are four types of product categories based on what trajectory they’re on:
- Fad. A fad is something that grows in popularity for a very short period of time and fades out just as quickly. A fad can be lucrative if your entry into the market and exit are timed perfectly, but this can be difficult to predict and a recipe for disaster.
- Trend. A trend is a longer-term direction that the market for a product appears to be taking. It doesn’t grow as quickly as a fad, it lasts longer and, generally, it doesn’t decline nearly as quickly.
- Stable. A stable market is one that generally is immune to shocks and bumps. It is neither declining or growing but maintains itself over long periods of time.
- Growing. A growing market is one that has seen consistent growth and shows signs of a long-term or permanent market shift.
2. Ran out of cash
Outside of poor sales, the main reason businesses run out of cash is due to bad forecasting. Forecasting is the process of predicting future sales and expenses based on historical data. If you don’t have any historical data, you can still base forecasts on expectations and quickly update your forecasts as you get real data. Forecasting may not be the most glamorous work, but it’s essential to the health of any business and much easier to control than your direct sales.
3. Not the right team
Starting a business requires a certain level of heroics—as the founder, you’ll be wearing a lot of hats. But any founder working with a co-founder, early contractors, or early employees knows that business really becomes a team sport. The primary reasons teams don’t work out are (A) a poor mismatch and overlap of skills and (B) poor team culture and cohesion.
Be wary of hiring your friends or people you personally like, and instead try to hire scrappy, resourceful people who help shore up your strengths in areas that matter to the business. E.g., if you’re already a strong marketer, but your business relies on streamlined operations, you might look to hire in that area to round out your team.
Data for this report was provided by the Bureau of Labor Statistics. The fourth chart is based on data provided by Owner.com, an online catering system for restaurants. See more Owner reviews here.